Truckload Performance in July 2021
July 2021 - Transportation Market Report
Every mode in the TL market remains significantly elevated in terms of load to truck ratios. After the expected dip in volume around Memorial Day, volumes came snapping back and have remained elevated. With the 4th of July holiday here, expect capacity to decrease and rates to increase beginning the week of 6/27 and lasting through 7/9.
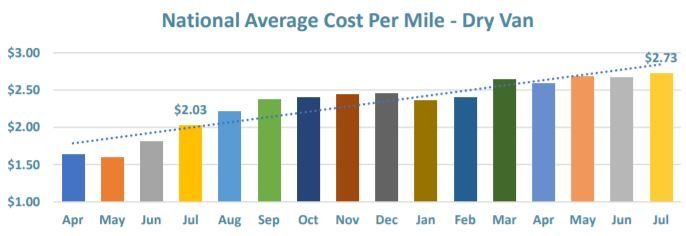
Dry Van: LTT & CPM
There’s no indication of a let up in terms of volume. Back to school projections are for $37B in spend (vs. $33.9 in 2020) and back to college projections are for $71B in spend (vs. $67.7B in 2020). Import volume projects will remain extremely high and domestic manufacturing is expected to remain strong. The NorCal/PNW remains an extreme challenge due to wildfires. Securing capacity will be a challenge for both IB/OB in this region.
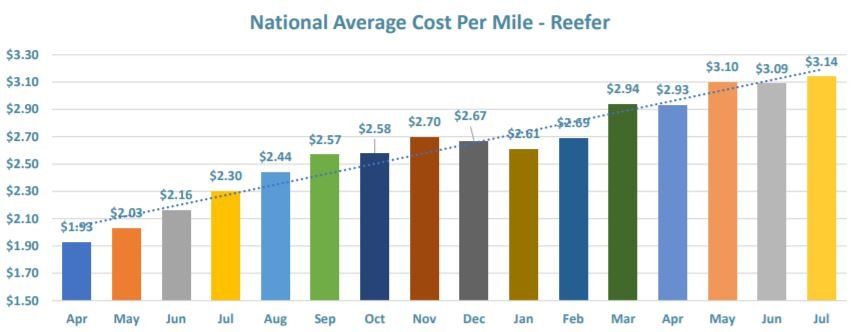
Reefer: LTT & CPM
The Reefer market continues to surge in terms of demand. Rejection rates are above 38%. Omaha NE, Little Rock AR, Des Moines IA, Savannah GA, and Ft. Wayne IN all have rejection rates over 60%. As we move through the end of produce season, expect reefer capacity to remain extremely tight. Reefer capacity will remain tight through all of July. Work with your carrier base to minimize service disruptions through the July 4th holiday. Tender lead times are key.
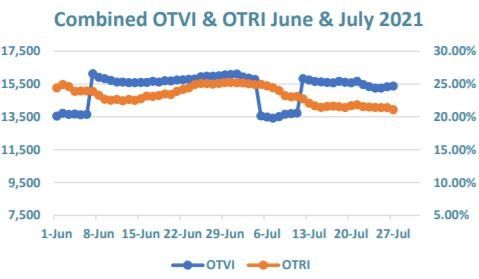
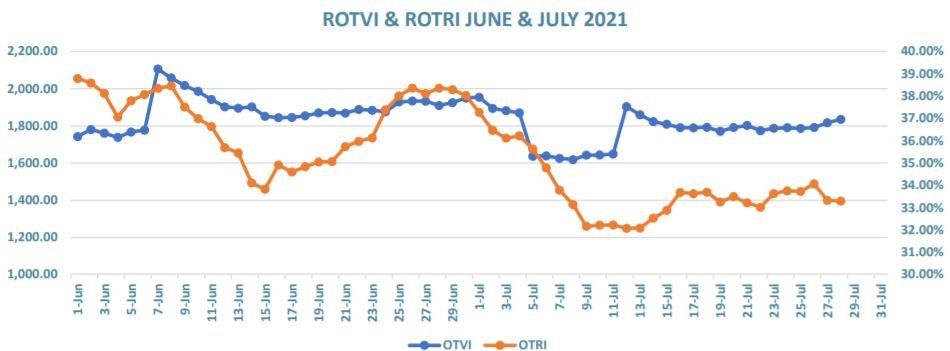
Reefer OTVI & OTRI
Although reefer rejections have dropped since late June, they have risen again towards the latter half of July and are currently ~33%. We aren’t expecting any significant relief in terms of reefer capacity in the month of August. Stay proactive with your carriers, and ensure load tenders are issued as far in advance as possible.
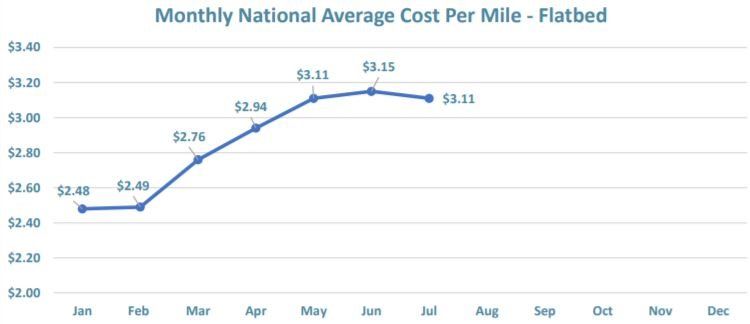
Flatbed: LTT & CPM
As we move into warmer weather, Flatbed utilization will continue to rise. Although new construction builds dropped in April, they came back in May, and rose again in June. New construction builds for June 2021 are up 42% vs. June 2020. Although the Load to Truck Ratio dropped in June, it still remains 2.5X what it reported in June 2020. It takes about 5 flatbed loads of lumber to produce 1 new home. 1.57M new homes were built in H1 of 2021.
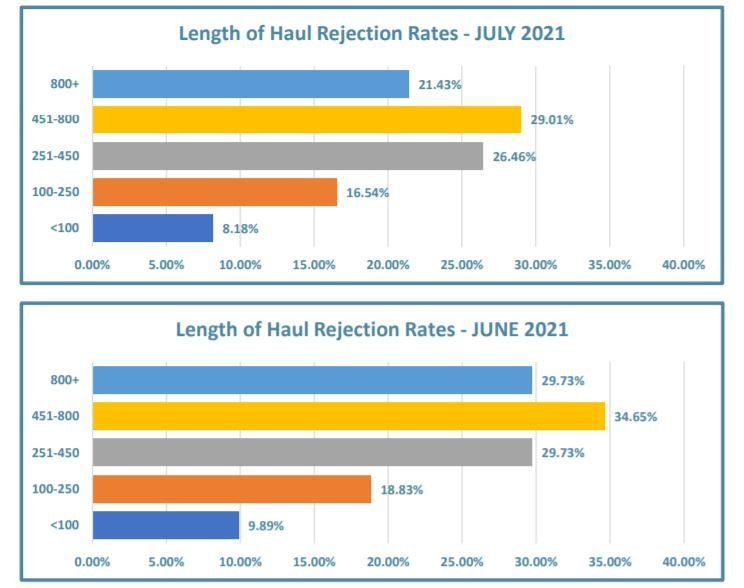
Domestic TL Length of Haul Rejections
This measures the rejection rate compared to a specific length of haul. Month on month we have seen a significant drop in rejections in almost all mileage bands. We believe this is due to shippers agreeing to higher contracted pricing vs. a material loosening of available capacity. The “Tweener” lane continues to have the highest Rejection rate by category. Previously, drivers could make the 450+ mile runs in a day. Due to HOS regulations, they are no longer able to do so. Ensure you are providing more than adequate lead time, and ensure appointments are set at both the shipper and receiver.
Key Takeaways
We feel the drop in rejection rates is more attributable to shippers agreeing to higher contracted pricing vs. a material loosening of capacity. Over 20% is still an incredibly high rate. 5%-8% is more indicative of a balanced market.
Click the button above to receive the full transportation market report for July 2021.