Market Update - Week of August 31, 2020

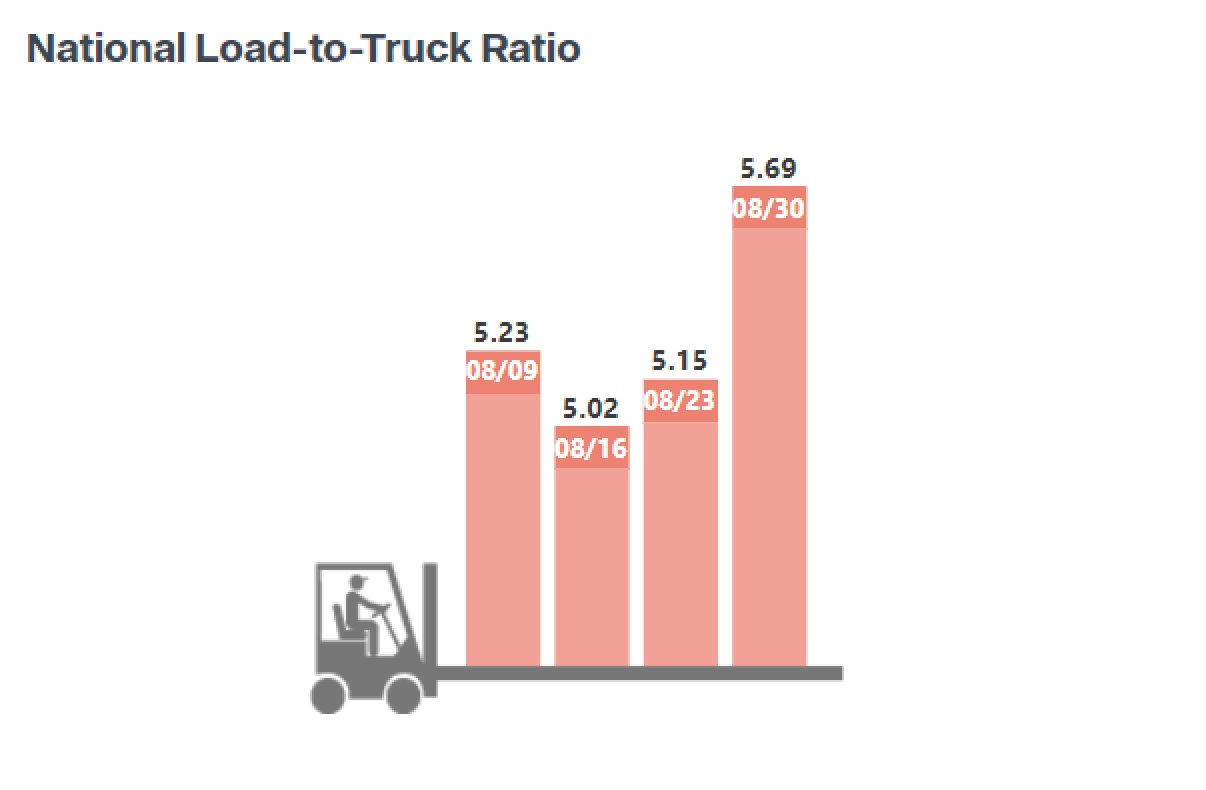
Compounding the issue is the CVSA Brake Inspection that happened last week. In these instances, carriers who feel they may be flagged if they are inspected intentionally choose not to drive and pull themselves off the road. Because of this, we are estimating that there was a 5% capacity hit. This is supported by the sharp increase in the van to load truck ratio. Two weeks ago, this was at 5.02 (the norm is around 2.0-2.2) and last week, it shot up to 5.69. There is an international CVSA Road Check also scheduled for 9/9-9/11, and we anticipate capacity to take another hit then. This is problematic, as we will also have the holiday on 9/7, so there will be more of a backlog of loads in the market as it is.
The National Average Cost Per Mile continues to climb as well. August wrapped up at $2.22/mile, which significantly outpaced the July number of $2.04. September is very high out of the gate at $2.30/mile. Hurricane Laura most certainly is contributing to rising prices, as well as (and probably more importantly) mismatched capacity in certain markets. To give you a little more color, we have been moving some volume out of Southern California to North Carolina. A year ago, the rate for this was around $3,000. Last week, we saw costs over $8,000. IMDL providers have also put in a $3,500 surcharge on spot cargo; they are honoring their committed book of business, but anything incremental is coming with an incremental price tag. It is of course difficult to predict when costs will return to a more normal level. The PMI hit 56 in August, which indicates increased domestic manufacturing levels, which have a direct impact on both Truckload and Less-than-truckload capacity.
Ocean/Air
Imports continue to remain strong, and July was a record month for the Port of Long Beach. It was the busiest month in the 109-year history of the port; they handled 753,081 TEUs. The previous single month record was June of 2018 at 752,188. We are hearing, however, about an increase in cancelled sailings for the month of October, which would indicate a decrease in orders from a purchasing standpoint. Unfortunately, even a potential decrease in volume will most likely not result in a decrease in costs. Currently, a blended rate from major ports in Asia to the West Coast are around $3,400, which is an all-time high. A year ago, that spot rate was around $1,300. The rate to the East Coast from those same origins is just shy of $4,000. A year ago, it was $2,600. Carriers are committed to pulling vessels out to mirror what demand looks like. They have also been very successful in implementing GRIs. There is yet another one tentatively coming out in two weeks. I would like to believe costs will come back down, but given the structure of the ocean freight industry where we only have 3 alliances in terms of options, and the carriers clearly committing to adjusting capacity to stay in line with demand, the current costs could prove to be sticky for the longer term.
Air freight in Q4 is going to remain extremely tight with elevated costs. Product launches with Apple, Sony, and Samsung are coming, which will dominate capacity requirements. PPE orders remain strong, and with the severe lack of passenger aircrafts to help move cargo, capacity/rates are going to remain a huge challenge moving forward.
Fuel
The National Average of On-Highway Diesel remains essentially flat. This week, it is $2.441, which is just $0.014 higher than it was two weeks ago. It’s all driven by the lack of consumption in auto/aviation/etc. of course, but essential businesses are able to benefit from this.

